Writing · Field notes
A/B Testing Is a Decision Problem
Why A/B testing is not just a stats exercise, and how to think about experiments in terms of business decisions, risk and commercial value.
Imagine we are testing a new checkout experience.
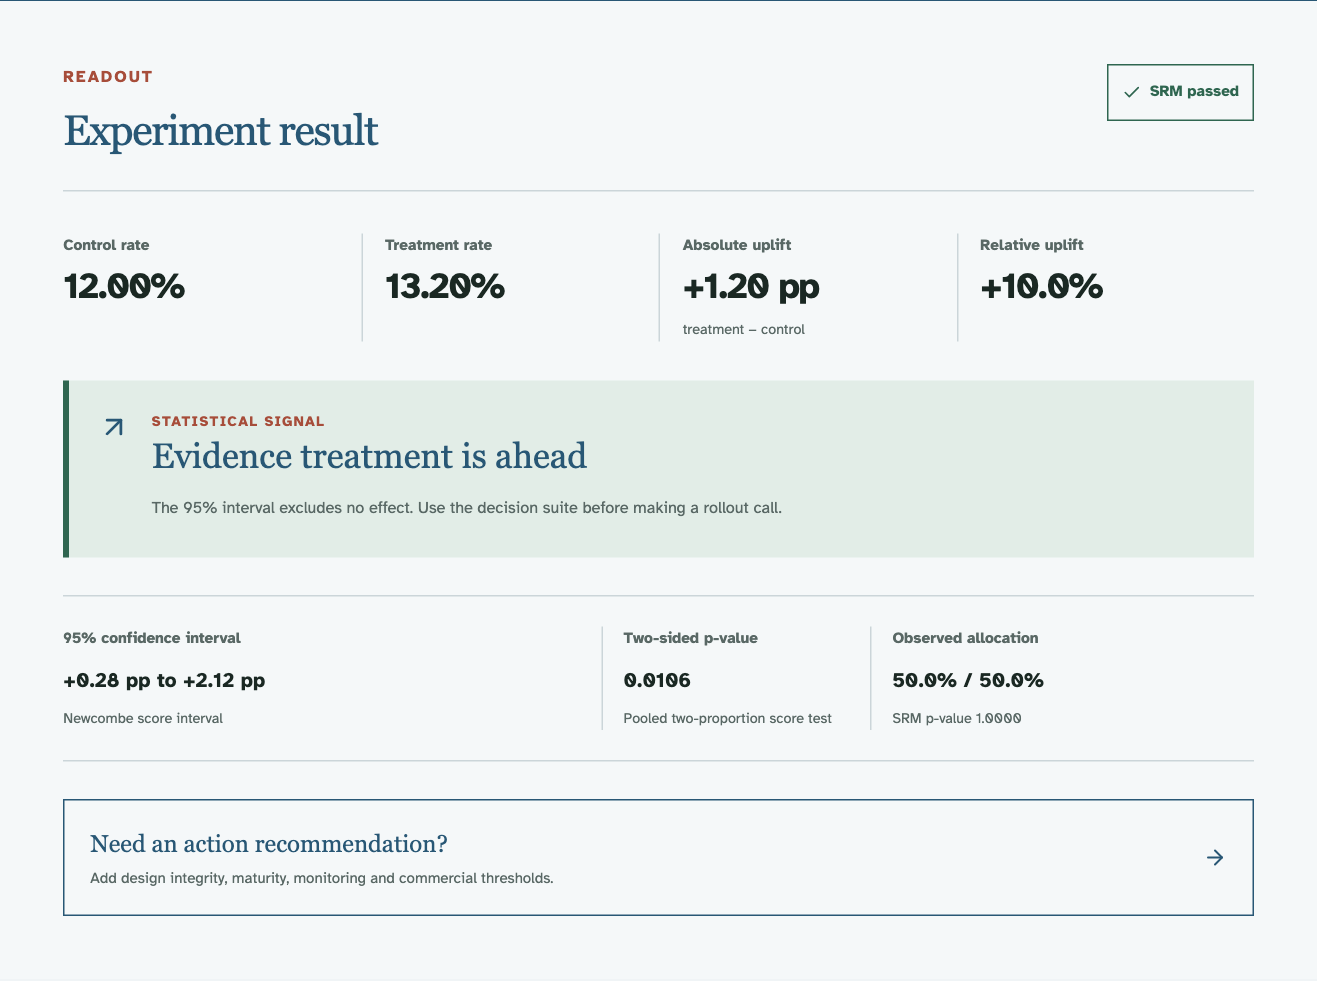
The existing checkout converts at around 12%. The new version looks better. After 20,000 users we have:
| Control | Treatment | |
|---|---|---|
| Users | 10,000 | 10,000 |
| Conversions | 1,200 | 1,320 |
| Conversion rate | 12.0% | 13.2% |
Treatment is up 1.2 percentage points, or 10% relatively.
I ran those numbers through my Experiment Decision Checker. Under a conventional fixed-horizon analysis, the p-value is about 0.011 and the 95% confidence interval for the absolute effect is roughly +0.28pp to +2.12pp.
So, should we ship it?
It is tempting to say yes.
And this is where experimentation gets interesting.
Because I haven’t actually told you enough to make that decision.
The p-value isn’t the decision
The first mistake is treating statistical significance as if it means:
There is a 99% chance Treatment is better.
It doesn’t.
The p-value answers a much narrower question about how surprising the observed data would be under a particular null hypothesis and statistical model.
It is useful. But it isn’t a probability that our decision is correct.
More importantly, the business probably doesn’t care whether the true effect is exactly zero.
It cares whether the effect is worth acting on.
Suppose changing checkout has implementation costs and operational consequences, and we decide beforehand that an improvement below +0.5 percentage points isn’t commercially interesting.
Ideally, that threshold was chosen before launch and informed the experiment’s sample-size and duration planning, rather than being invented after seeing the result.
Our interval is:
+0.28pp → +2.12pp
Now the problem looks different.
The data provide evidence of an improvement under the conventional test, but the remaining plausible range still contains effects that are statistically detectable but commercially uninteresting.
So I wouldn’t describe this as:
Treatment won.
I’d describe it as:
Treatment looks promising, but the current uncertainty still spans both commercially marginal and very valuable outcomes.
Those are different statements.
And they can lead to different decisions.
Then someone admits they’ve been checking the dashboard every morning
This happens all the time.
We design an experiment and talk as though nobody will inspect it until some sacred end date.
Then the experiment goes live and everyone checks it.
Tuesday:
Treatment is up 8%.
Wednesday:
It’s up 11%.
Thursday:
We’re significant.
Friday:
Can we ship it?
There is nothing inherently wrong with looking at an experiment while it runs.
The statistical problem is pretending afterwards that we didn’t.
An ordinary fixed-horizon test assumes the stopping rule wasn’t driven by repeatedly observing the result. If we continuously peek and stop when the p-value happens to cross 0.05, the false-positive behaviour is no longer what the original calculation promised.
One answer is to tell everyone not to look.
In my experience, that’s not a particularly realistic product strategy.
A better answer is to use a sequential method designed for repeated observation.
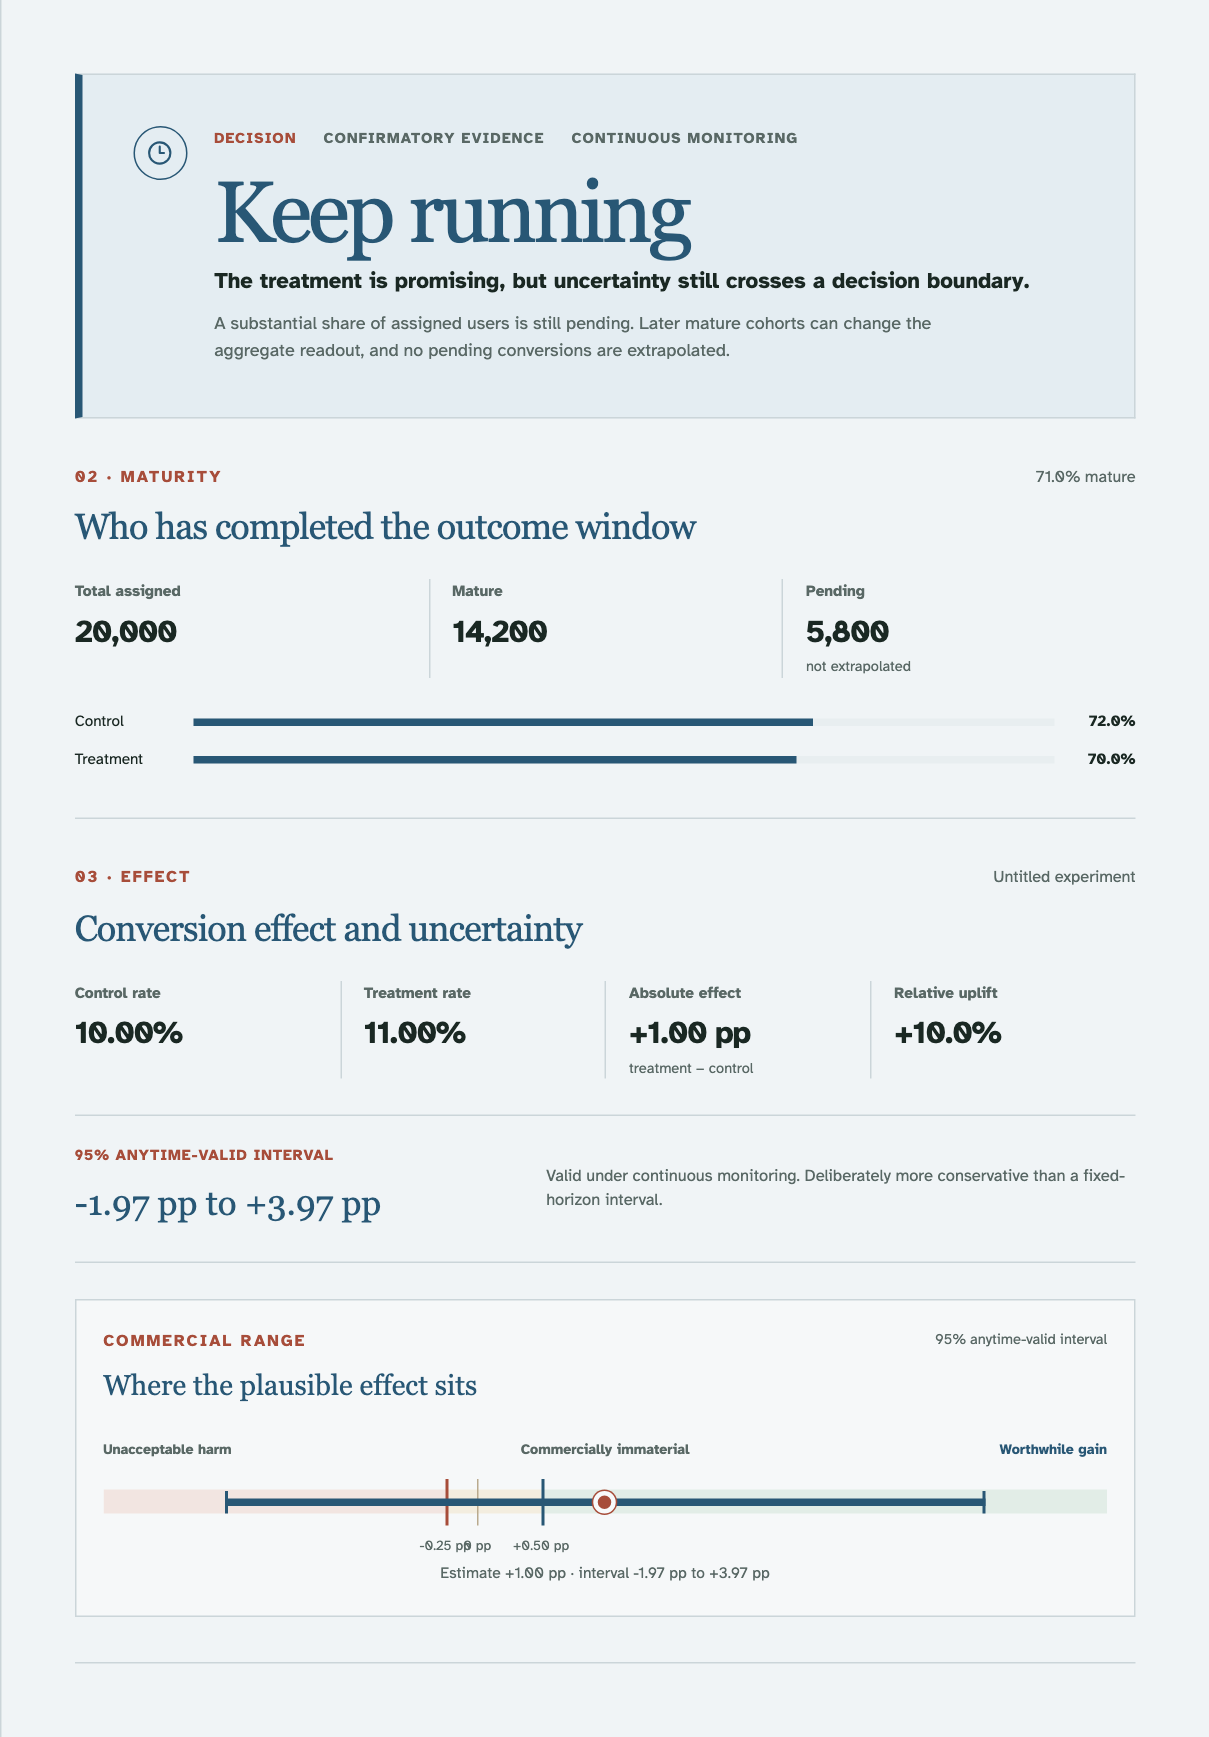
The Experiment Decision Checker uses an anytime-valid approach for continuously monitored experiments. The interval is deliberately more conservative than the corresponding fixed-horizon interval.
Nothing about the observed customers has changed.
What changed was the question we asked of the statistics.
The fixed-horizon analysis asks something like:
If this was the predetermined analysis point, what does the evidence look like?
The sequential analysis asks:
What can we safely conclude if we have been free to inspect this experiment repeatedly and potentially stop because of what we saw?
That’s not one method being “right” and the other being “wrong”.
They make different assumptions about how the experiment was actually run.
My bigger pet peeve: is the sample even mature?
There is another problem I see discussed far less often.
Suppose our metric isn’t simply:
Converted.
It is:
Converted within seven days of entering the experiment.
The dashboard might say we have 20,000 users.
But someone exposed eight days ago has had the full seven days in which to convert.
Someone exposed yesterday has had one.
Someone exposed an hour ago has barely had an opportunity at all.
Those observations are not equally mature.
Imagine the real state is:
| Control | Treatment | |
|---|---|---|
| Assigned | 10,000 | 10,000 |
| Mature for D7 | 7,200 | 7,000 |
| D7 conversions | 720 | 770 |
| Mature conversion | 10.0% | 11.0% |
We don’t really have 20,000 completed observations for our D7 metric.
We have:
20,000 assigned
14,200 mature
5,800 still awaiting their full outcome window
Only 71% of the sample is mature.
That matters.
And simply dividing conversions by everyone assigned can produce a nonsensical answer, because recent users haven’t had the same opportunity to convert.
There is another subtlety too.
A treatment can change when somebody converts without changing whether they eventually convert.
Imagine cumulative conversion looks like this:
| D1 | D3 | D7 | |
|---|---|---|---|
| Control | 5.0% | 8.4% | 10.0% |
| Treatment | 7.1% | 9.5% | 10.2% |
At D1, Treatment looks transformative.
At D7, most of that difference has disappeared.
If the business decision is based on seven-day conversion, declaring victory from an immature cohort isn’t merely statistically aggressive.
We’re measuring the wrong point in the customer journey.
This is why I think experiment dashboards should distinguish clearly between:
users assigned
and
users whose outcome is mature
rather than presenting one impressive-looking sample size.
A more sophisticated analysis could use time-to-event methods and make use of partially observed users rather than simply excluding them. But even the basic discipline of acknowledging maturity avoids a surprising amount of false confidence.
There isn’t even one statistical question
So far I’ve assumed we’re asking:
Is Treatment better than Control?
But businesses don’t always need to answer that question.
Suppose the new checkout costs substantially less to operate.
Now perhaps the question is:
Can we rule out Treatment being more than 0.2 percentage points worse?
That’s a non-inferiority problem.
Or perhaps we’re replacing an old system with something dramatically simpler and just need confidence that customer behaviour is effectively unchanged.
Then the question might be:
Can we rule out effects outside −0.2pp to +0.2pp?
That’s closer to an equivalence problem.
And this exposes something important.
A non-significant result does not mean we’ve demonstrated that two treatments are equivalent.
Likewise, a significant result doesn’t tell us whether the difference is commercially important.
The statistical question needs to follow the decision we’re actually trying to make.
One-sided or two-sided?
This comes up constantly in commercial experimentation too.
Often the hypothesis really is directional:
We think Treatment will improve conversion.
In that case a pre-specified one-sided superiority test can be reasonable when the inferential question is genuinely directional, while downside and guardrail risks still need to be monitored separately.
But the phrase pre-specified matters.
Looking at the result, noticing Treatment is ahead, and then deciding we really meant a one-sided hypothesis is just finding a more convenient statistical question after seeing the answer.
And even where our proof of benefit is directional, the business shouldn’t suddenly stop caring about harm.
We might have:
Minimum worthwhile gain: +0.5pp
but:
Maximum tolerable loss: −0.2pp
Those boundaries don’t have to be symmetric.
In fact, commercially, they often aren’t.
What if we use Bayesian statistics instead?
This is often where discussions become unnecessarily tribal.
A Bayesian analysis might let us express an experiment in language that maps more naturally onto decisions.
Instead of asking only whether the data would be surprising under a null hypothesis, we might ask:
What is the probability Treatment is better than Control?
Or more usefully:
What is the probability the uplift exceeds our +0.5pp worthwhile threshold?
And:
What is the probability the effect crosses our −0.2pp unacceptable-loss boundary?
Those statements can be easier for decision makers to reason about than a p-value.
But Bayesian statistics hasn’t magically removed uncertainty.
We’ve changed the framework used to represent it, and introduced assumptions including our prior model.
That may be an excellent trade.
It still isn’t a truth machine.
The part I find more interesting is what the business stands to lose
Suppose we eventually believe Treatment is probably beneficial, but uncertainty remains.
Should we keep running?
Statistics alone can’t answer that.
Imagine Treatment has a large potential upside, rollout is reversible, and the plausible downside is small.
Every extra week spent experimenting has a cost because customers who could have received the better experience remain on Control.
Waiting has become a decision too.
Now reverse the situation.
Suppose rollout is difficult to reverse and a bad decision could cost hundreds of thousands of pounds.
Waiting another week is comparatively cheap.
We should demand stronger evidence.
Same observed experiment.
Same statistical model.
Different rational decision.
This is where I think experimentation becomes less about significance testing and more about decision theory.
There are costs associated with every mistake.
A false positive costs us something.
A false negative costs us something.
Keeping customers in a harmful treatment while gathering another week’s data costs us something.
Delaying a genuinely valuable improvement costs us something.
And sometimes the cost of gathering more evidence is greater than the value of the uncertainty that evidence might remove.
So what are we actually trying to optimise?
This is why I’ve gradually become less interested in the question:
Has the experiment reached statistical significance?
and more interested in:
Do we have enough trustworthy information to make the commercial decision?
A primary-metric win is not automatically a rollout decision. If conversion improves while refunds, cancellations, margin or another pre-specified guardrail deteriorates materially, that changes the decision too.
The same caution applies when we’ve searched across many metrics, variants or segments: the more questions we ask of the same random data, the easier it becomes to find something apparently interesting by chance.
To answer the decision properly, I want to know several things.
Was the experiment validly designed?
Did randomisation actually work?
Is there sample ratio mismatch?
Could Treatment affect people assigned to Control through shared inventory, capacity, pricing or network effects?
Is the metric the one we chose before looking at the result?
Are the important guardrails healthy?
Is the outcome mature?
Have we been continuously monitoring the experiment?
How many metrics, variants or segments have we inspected?
What range of effects is still reasonably compatible with the data?
Which of those effects would actually matter commercially?
What would it cost us to make the wrong decision?
And what does it cost us to wait?
Only then do I really care whether the answer is:
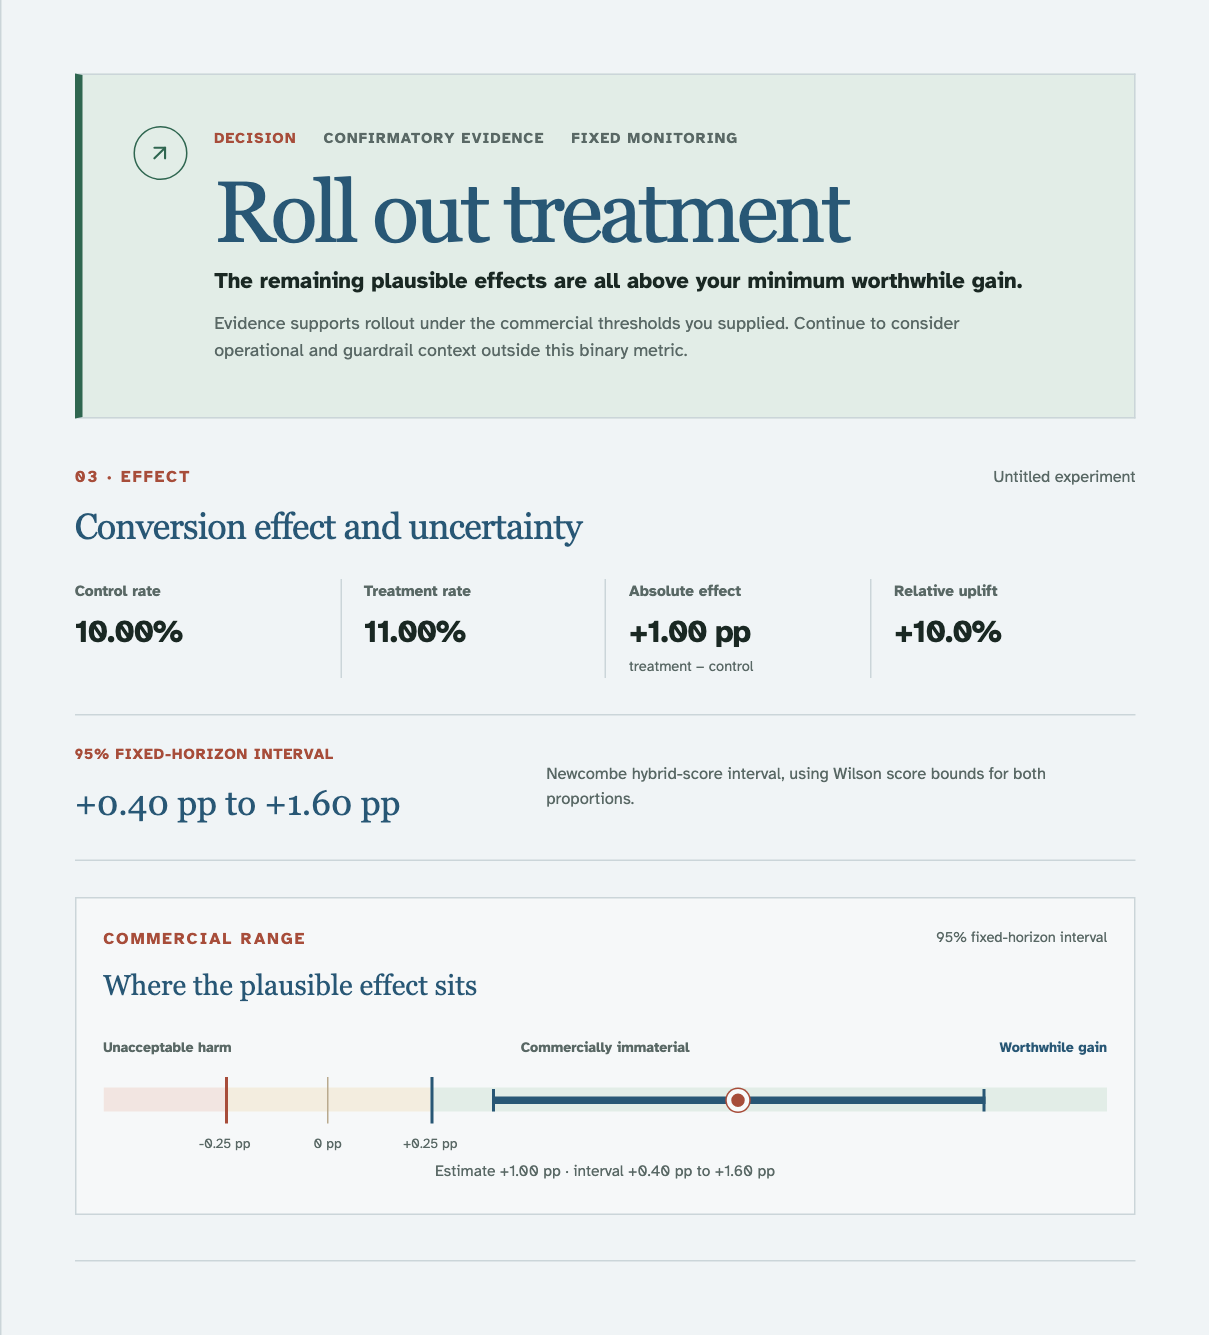
Roll out.
Keep running.
Stop.
There is enough precision to conclude that any remaining effect is commercially immaterial.
Or:
Something about this experiment needs investigating before we interpret anything.
Statistics doesn’t remove the risk
Experiments give us random data.
Statistical methods give us different ways to impose rigour on the conclusions we draw from that data.
Frequentist tests help us control particular long-run error rates.
Confidence intervals help us reason about the range of effects compatible with our observations and assumptions.
Sequential methods let us repeatedly inspect accumulating evidence while retaining defined error guarantees.
Bayesian methods give us another coherent language for uncertainty.
Commercial thresholds tell us which portions of that uncertainty actually matter.
Expected value and regret can take us further still, by attaching consequences to the mistakes we might make.
There isn’t one perfect method that turns a random sample into certainty.
And I don’t think that’s a weakness of statistics.
It’s the point.
The real job is to understand the uncertainty well enough to make a decision while being explicit about the risk we’re accepting.
Statistics cannot remove uncertainty. It helps us understand it well enough to choose which risk we’re willing to take.
That’s the idea behind the Experiment Decision Checker I’ve been building: moving the conversation away from “did the p-value turn green?” and towards validity, maturity, uncertainty and commercial consequences.
The current version focuses on binary A/B tests, validity, maturity, fixed versus continuous monitoring, uncertainty and commercial thresholds. Bayesian inference, one-sided testing, explicit non-inferiority or equivalence testing, and multiplicity correction are ideas discussed here rather than current features.
Because the point of an experiment was never the p-value.
It was the decision.